TM 55-1945-205-10-4
0015 00 7
0015 00
4.
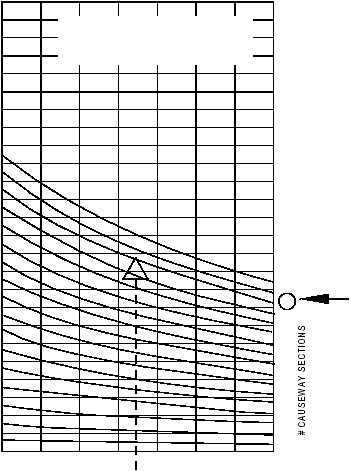
As an example, assume the following conditions:
a.
Sea State: 3
b.
Tide Range: 3.5
c.
Bottom Slope: 1:100
5.
Using Sea State 3 graph, locate intersection of bottom slope and tide range. If intersection of bottom slope and
tide range falls between two curves, select curve for greater number of causeway sections. A fifteen section
causeway is required for given conditions in the example.
B O T T O M
SLO PE
(t100)
NUM BER OF
CAUSEW AY
SECTIONS
(15 EACH)
TIDE
RANGE
(3.5 FT)
17
1 6
15
14
1 3
12
10
9
8
7
6
5
4
3
2
1
250
240
230
220
210
200
190
180
170
160
150
140
130
120
110
100
90
80
70
60
50
40
30
20
10
0
11
0
1
2
3
4
5
6
7
TIDE RANGE (FEET)
SEA STATE 3
W ATER DEPTH (END O F PIER) = 6 FT
W ATER W AVE TRO UG H = 3 FT
EXAM PLE


